Understanding what is Statistical Regularity with a Ludo & Paper Game

Hi,…
In this tutorial we will learn what is Statistical Regularity ???
Actually, I am writing this blog, because when I first read about this Statistical Regularity from one of my favorite teacher, Professor Arnab Chakraborty’s blog, where he has described the concept of statistical regularity with a beautiful example; I was so excited, but there he did not give the actual solution of that example(i.e., the coding part). So, here I am giving my solution which is actually very easy, and I think that’s why he did not give the coding 😅 😅 😅. But, I was very happy to do that by myself, and that’s why now I like to share that with you. I guess you will enjoy it…
So, before going to the example part, let me give a brief introduction on what is Statistical Regularity is.
Ststistical Regularity
Statistical regularity is different from mathematical patterns in the sense that it is rarely exactly replicated, it is extremely similar but not the same. We see this all around us. Our finger prints, for example, or the leaves on a tree.
Statistical regularity is like a mysterious black box which takes random unpredictable input and somehow digests the randomness to produce regular output. No doubt, if we can master this technique then it should help the predictable output from unpredictable inputs! The quite predictable profit of the Casino owner or insurance companies are examples.
Statistical regularity takes many forms, some more dramatic, some less. The simplest occurrence of the phenomenon was first proved mathematically by Jakob Bernoulli.The theorem and its proof will hardly fill a page completely. But it took 25 years to figure out how to tackle randomness using mathematics to arrive at the proof!
So, mathematically,
Consider a random experiment. so as it is known that, the result of a single random experiment can never be correctly predicted before conducting the experiment, if the random experiment is carried out a large number of times under identical conditions it will be seen that the Relative Frequency (R.F) of an event stabilizes to a certain value.
The Relative Frequency (R.F) of an outcome, \(O\) (say), of an experiment is the number of time \(O\) occurs, \(f_n (O)\), divided by the total number of times, \(n\), the experiment is carried out.
So, the Relative Frequency (R.F) of an outcome \(O\) is:\[r_n (O)=\frac{f_n (O)}{n}\:\:;clearly\:0\leq r_n (O)\leq 1\]. It is seen that when the experiment is repeated indefinitely, \(r_n (O)\) tends to a certain value, \(p\) (say); where \(0 \leq p \leq 1\).
for example :
A coin was tossed several times and the no. of times it fell Heads was noted. The following table shows the no. of Heads (H) obtained in sets of \(n\) experiments.
| Set | n=10 | n=50 | n=100 |
|---|---|---|---|
| 1 | 4 | 29 | 47 |
| 2 | 4 | 22 | 52 |
| 3 | 6 | 24 | 54 |
| 4 | 7 | 27 | 49 |
| 5 | 5 | 31 | 53 |
| 6 | 5 | 26 | 51 |
| 7 | 3 | 25 | 48 |
| 8 | 7 | 28 | 52 |
| 9 | 5 | 21 | 47 |
| 10 | 6 | 23 | 55 |
| Total | 52 | 256 | 508 |
For N=10, Relative Frequency (R.F), r(H) varies from 0.3 to 0.7.
For n=50, extreme values of r(H) become closer being 0.42 & 0.62.
For N=100, r(H) varies between 0.47 & 0.55.
The average values of \(r(H)\) were 0.520, 0.512, 0.508 for \(n\)= 10, 50 ,100, respectively. Thus one may conclude that as \(n\) increases Relative Frequency of H will be expected to be very close to 0.50.
Ok, so we have understand what is Statistical Regularity. Now, It’s time to jump into our main example.
The ‘Ludo & Paper Game’
Theory
- We take four pieces of paper and write the following formulas on them:
1 \[X_{(new)}=0.8*X_{(old)}+0.1\] \[Y_{(new)}=0.8*Y_{(old)}+0.04\] 2 \[X_{(new)}=0.5*X_{(old)}+0.25\] \[Y_{(new)}=0.5*Y_{(old)}+0.04\] 3 \[X_{(new)}=0.355*X_{(old)}-0.355*Y_{(old)}+0.266\] \[Y_{(new)}=0.355*X_{(old)}+0.355*Y_{(old)}+0.078\] 4 \[X_{(new)}=0.355*X_{(old)}+0.355*Y_{(old)}+0.378\] \[Y_{(new)}=-0.355*X_{(old)}+0.355*Y_{(old)}+0.434\]
These are all formulas to compute two numbers, \(X_{(new)}\) and \({Y_(new)}\) from two other numbers \(X_{(old)}\) and \(Y_{(old)}\).
We shall play a game of Ludo with these! The Ludo board will be \(\mathbb{R}^2\), and the counter will be a single point, which is initially at \((X,Y)=(0,0)\). Draw one of the four pieces of paper at random and apply the formula on it to compute the new position of the counter. Keep on doing this. A every step you are drawing one of the four papers at random (same paper may get picked many times). All the counter positions are marked as dots.
R code
play=function(n)
{
  X.old=0
  Y.old=0

  X.all=NULL
  Y.all=NULL

  for(i in 1:n)
  {
    sam=sample(1:4,1,replace=T)

    if(sam==1)
    {
      X.new=0.8*X.old+0.1
      Y.new=0.8*Y.old+0.04
    }
    else if(sam==2)
    {
      X.new=0.5*X.old+0.25
      Y.new=0.5*Y.old+0.4
    }

    else if(sam==3)
    {
      X.new=0.355*X.old-0.355*Y.old+0.266
      Y.new=0.355*X.old+0.355*Y.old+0.078
    }

    else
    {
      X.new=0.355*X.old+0.355*Y.old+0.378
      Y.new=-0.355*X.old+0.355*Y.old+0.434
    }

    X.all[i]=X.new
    Y.all[i]=Y.new
    X.old=X.new
    Y.old=Y.new
  }

  plot(X.all,Y.all,
              pch=16,
              col="darkgreen",
              cex=.7,
              axes=F,
              xlab="",
              ylab="",
       main="Ludo & Paper Game Population")
  box()
}

Ans=play(100000) #--- Playing this game 10000 times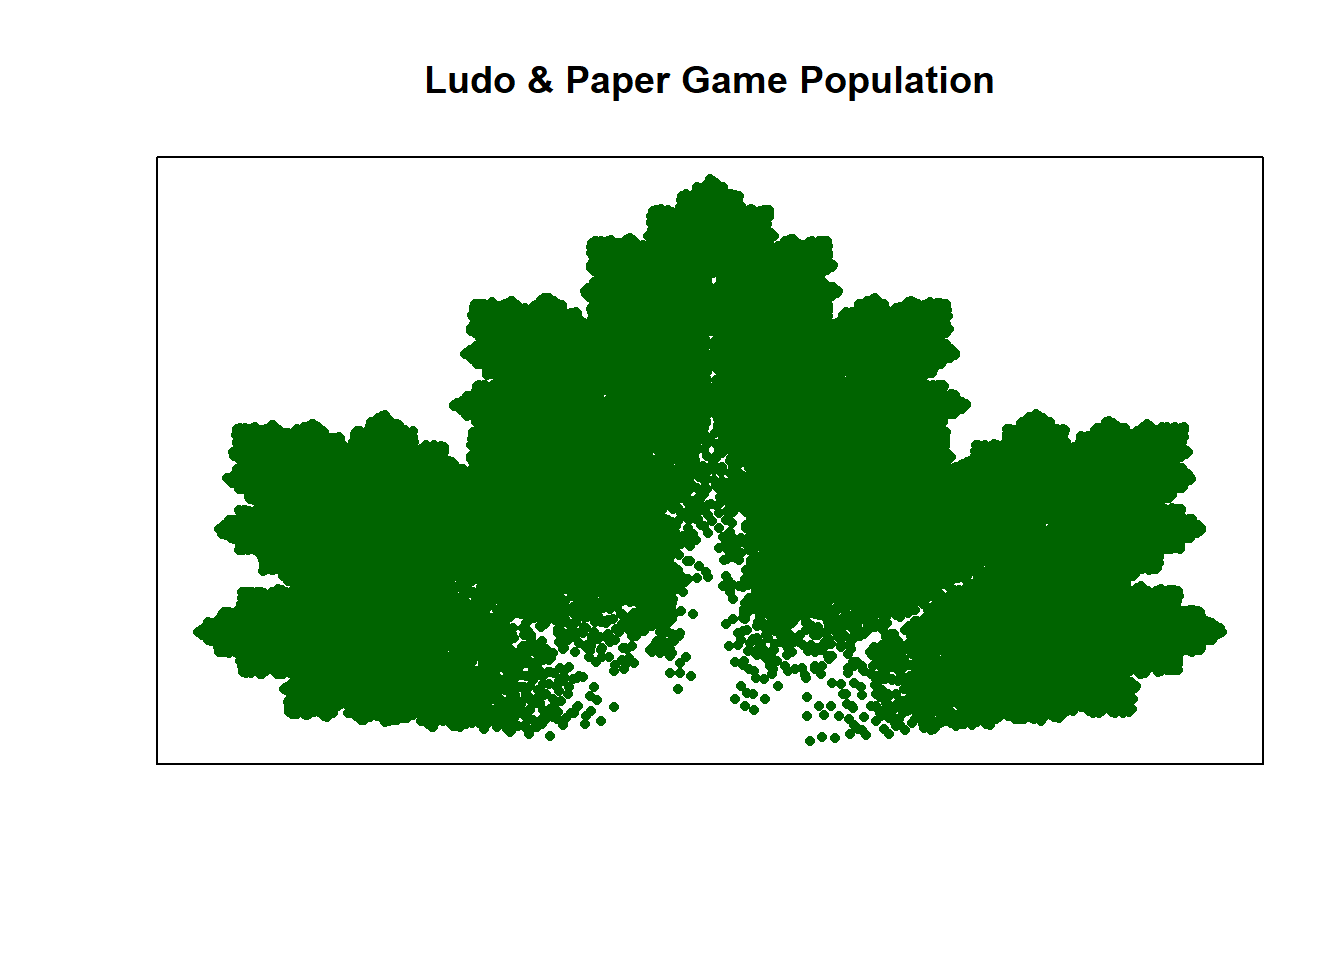
So, actually, individual outcomes are random, but, when the number of trials are very large, then the experiment looses it’s randomness and gives a known structural shape which is very interesting.
Thank you for reading…